1import sys
2import numpy as np
3import matplotlib.pyplot as plt
4
5# If using from local source during development
6sys.path.insert(1, '../src')
7import chrispytools.plot as cplt
8import chrispytools.signalprocessing as csig
9
10
11# time axis
12t = np.linspace(0, 1, int(1e3), endpoint=False)
13
14# Clock: square wave
15clock = 2.5 * (np.sign(np.sin(2 * np.pi * 20 * t)) + 1) / 2
16clock += 0.2 * np.random.randn(len(clock))
17
18# Data: slower square wave with noise
19data = 2.5 * (np.sign(np.sin(2 * np.pi * 5 * t)) + 1) / 2
20data = np.roll(data, 10)
21data += 0.2 * np.random.randn(len(data))
22
23# Chip Select: active for two windows
24chipselect = np.zeros_like(t)
25chipselect[200:500] = 2.5
26chipselect[650:900] = 2.5
27chipselect += 0.2 * np.random.randn(len(chipselect))
28
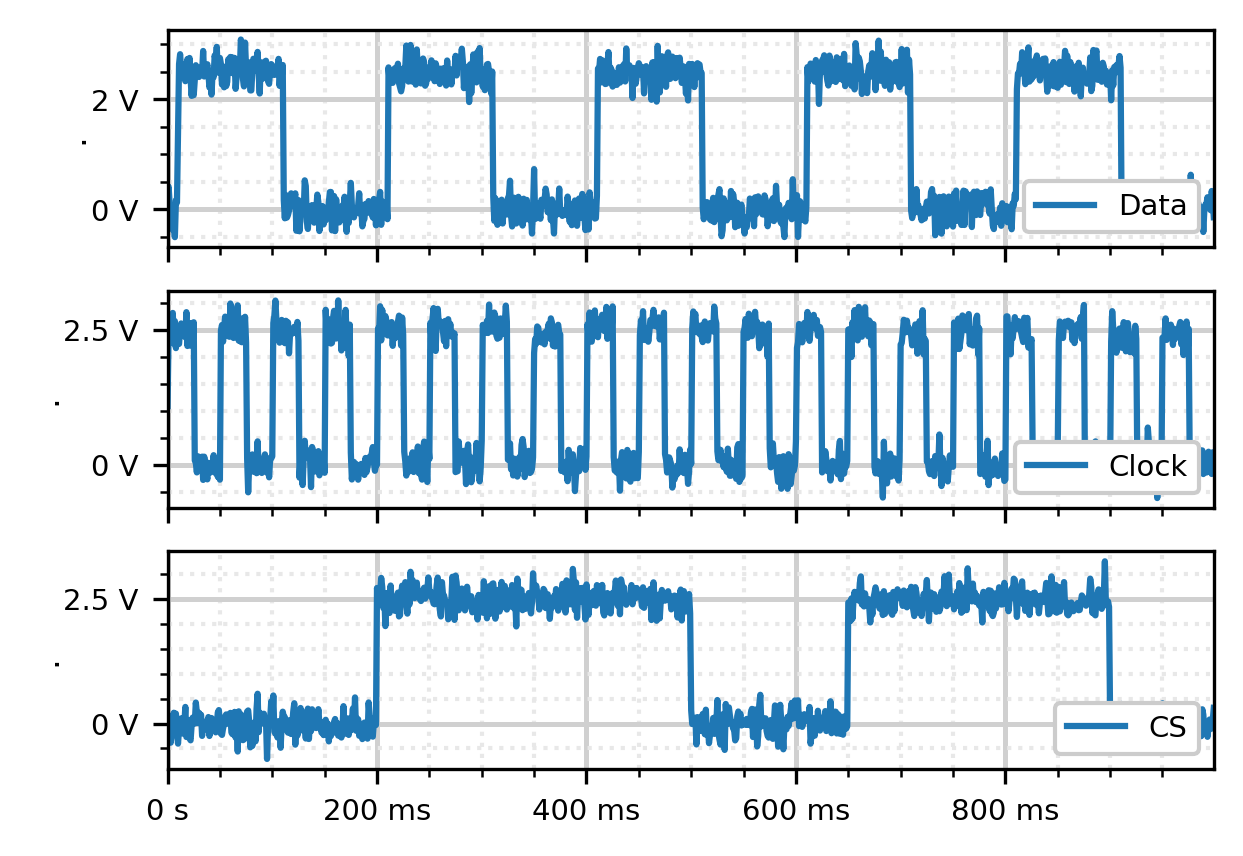
29# Create Plot to see the raw signal
30fig = plt.figure(figsize=(4.5, 3.2), dpi=300)
31x_label = ["", "s"]
32y_label = [".", "V"]
33
34ax1 = plt.subplot(311)
35cplt.LinearPlot(ax1, [[t, data, "Data"]], x_label, y_label)
36
37ax1.xaxis.set_ticklabels([])
38handles, labels = ax1.get_legend_handles_labels()
39ax1.legend(handles, labels, framealpha=1, columnspacing=0.75, handlelength=2,
40 frameon=True, fontsize=7, loc=4)
41
42ax2 = plt.subplot(312)
43cplt.LinearPlot(ax2, [[t, clock, "Clock"]], x_label, y_label)
44
45ax2.xaxis.set_ticklabels([])
46handles, labels = ax2.get_legend_handles_labels()
47ax2.legend(handles, labels, framealpha=1, columnspacing=0.75, handlelength=2,
48 frameon=True, fontsize=7, loc=4)
49
50ax3 = plt.subplot(313)
51cplt.LinearPlot(ax3, [[t, chipselect, "CS"]], x_label, y_label, LegendLoc=4)
52
53handles, labels = ax3.get_legend_handles_labels()
54ax3.legend(handles, labels, framealpha=1, columnspacing=0.75, handlelength=2,
55 frameon=True, fontsize=7, loc=4)
56
57plt.show()
58
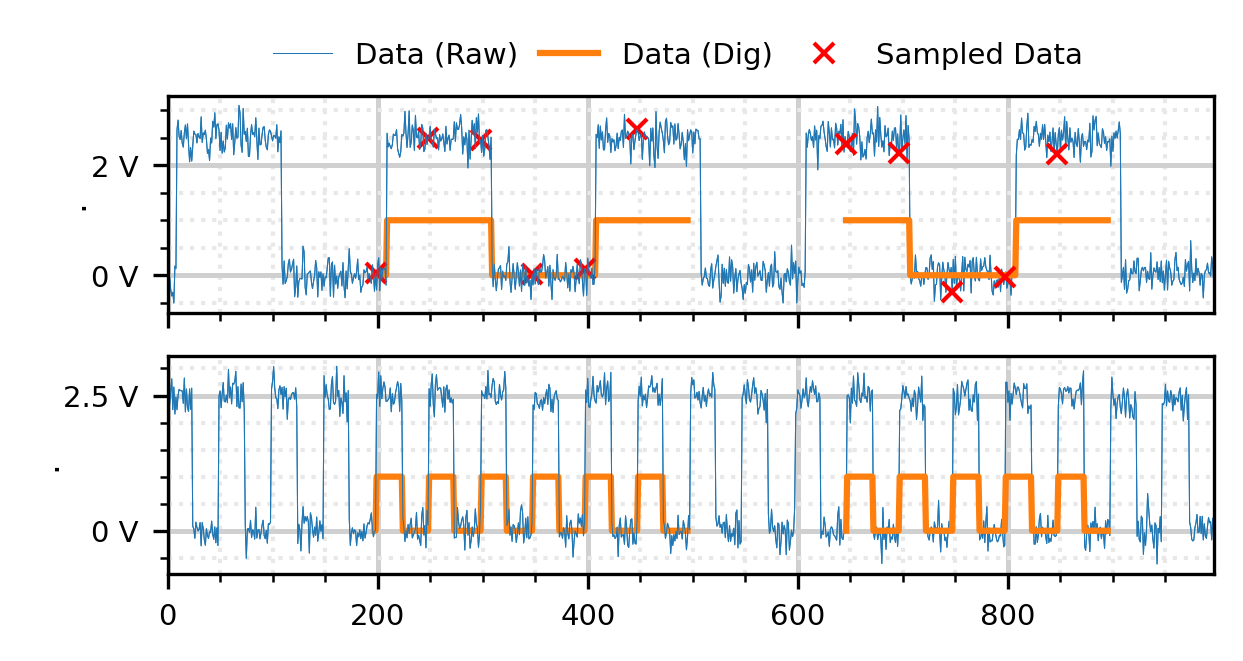
59# Run Digitalize_Data
60binary_data, debug_output = csig.Digitalize_Data( data=data, clock=clock,
61 edge_trigger="rising",
62 chipselect = chipselect,
63 threshold_high=1.8, threshold_low=0.7,
64 debug=True, muteWarnings=False )
65
66
67
68fig = plt.figure(figsize=(4.5, 3.2), dpi=300)
69
70# Create Plot to see the processed signal
71ax1 = plt.subplot(311)
72ax2 = plt.subplot(312)
73
74x_label = ["", ""]
75y_label = [".", "V"]
76
77for debug in debug_output:
78
79 start = debug['cs_start']
80 stop = debug['cs_stop']
81
82 samples = np.arange(0, len(debug['data']))
83 samples_dig = np.arange(start, stop)
84
85 norm_data = debug['data_dig'][start:stop] / np.max(debug['data_dig'][start:stop])
86 norm_clk = debug['clk_dig'][start:stop] / np.max(debug['clk_dig'][start:stop])
87
88 cplt.LinearPlot(ax1, [[samples, debug['data'], "Data (Raw)", "lw=0.25, color=C0"],
89 [samples_dig, norm_data, "Data (Dig)", "color=C1"],
90 [debug['clk_edge'], debug['data'][debug['clk_edge']], "Sampled Data", "lw=0, marker=x, markersize=5, color=red"]],
91 x_label, y_label, Legend = False)
92
93 cplt.LinearPlot(ax2, [[samples, debug['clk'], "Clk (Raw)", "lw=0.25, color=C0"],
94 [samples_dig, norm_clk, "Clk (Dig)", "color=C1"]],
95 x_label, y_label, Legend = False)
96
97ax1.xaxis.set_ticklabels([])
98handles, labels = ax1.get_legend_handles_labels()
99ax1.legend(handles[0:3], labels[0:3], framealpha=1, columnspacing=0.75, handlelength=2,
100 frameon=False, fontsize=7, ncols=3, loc=4, bbox_to_anchor=(0.9, 1))
101
102plt.show()